Positional Bias - ViT Layer Heirarchy
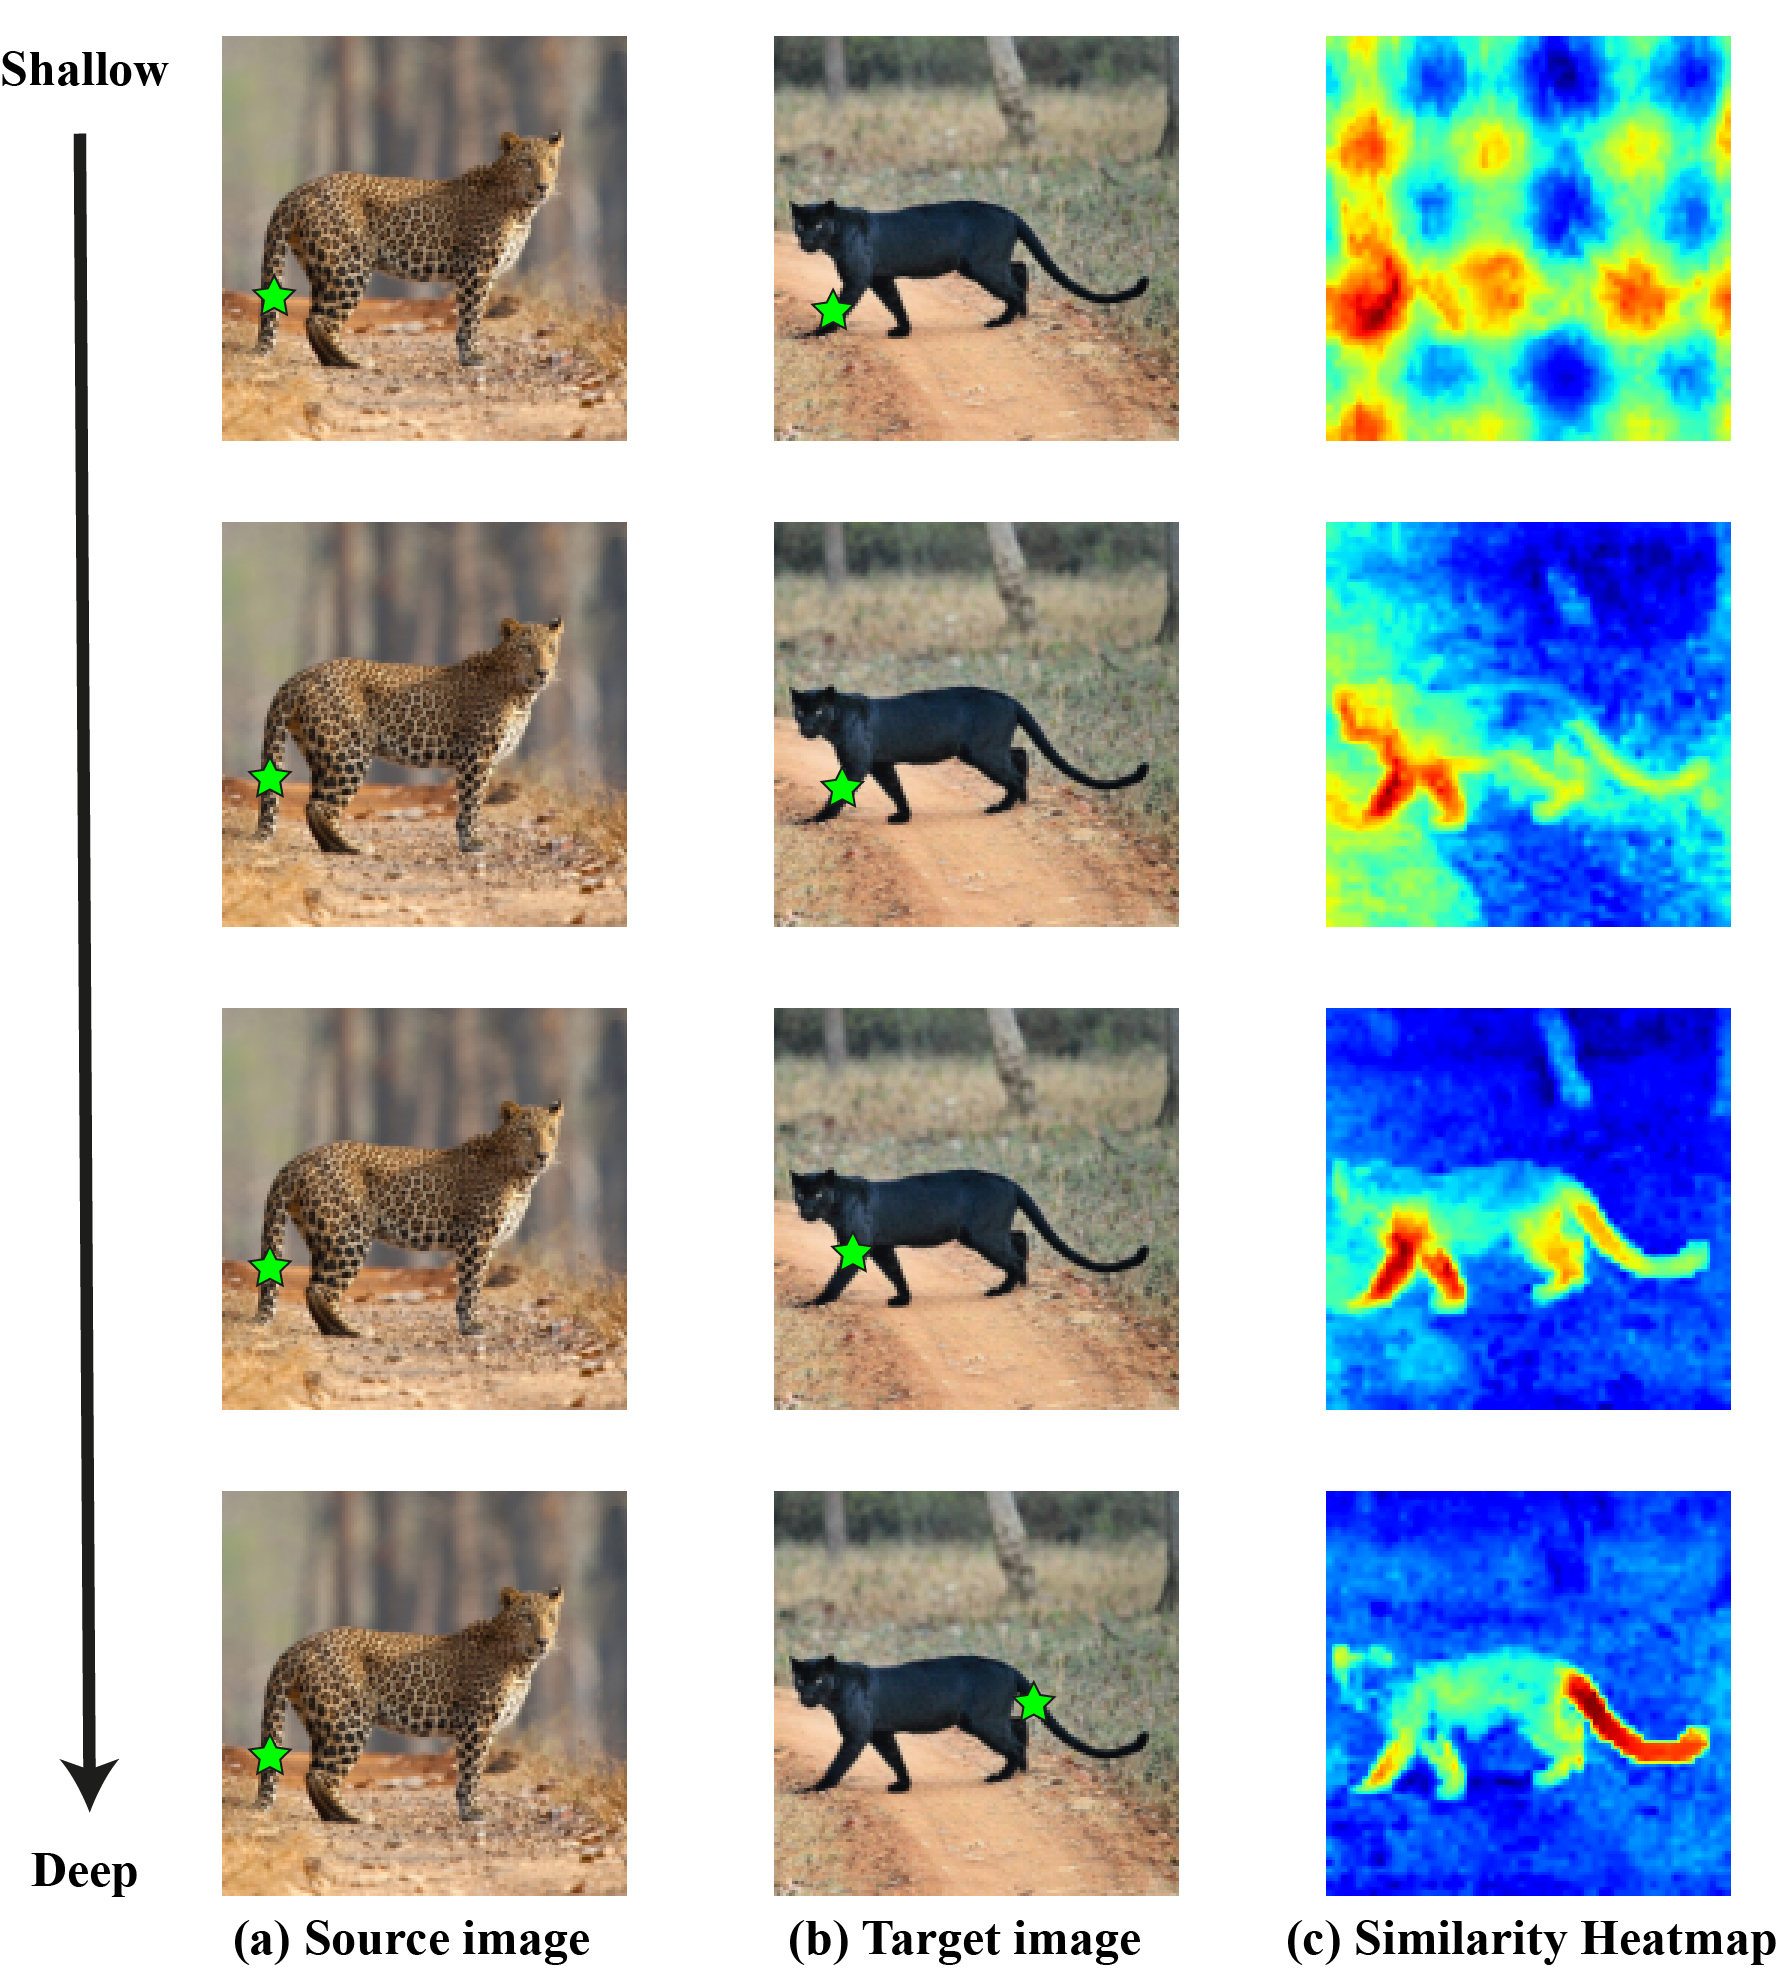
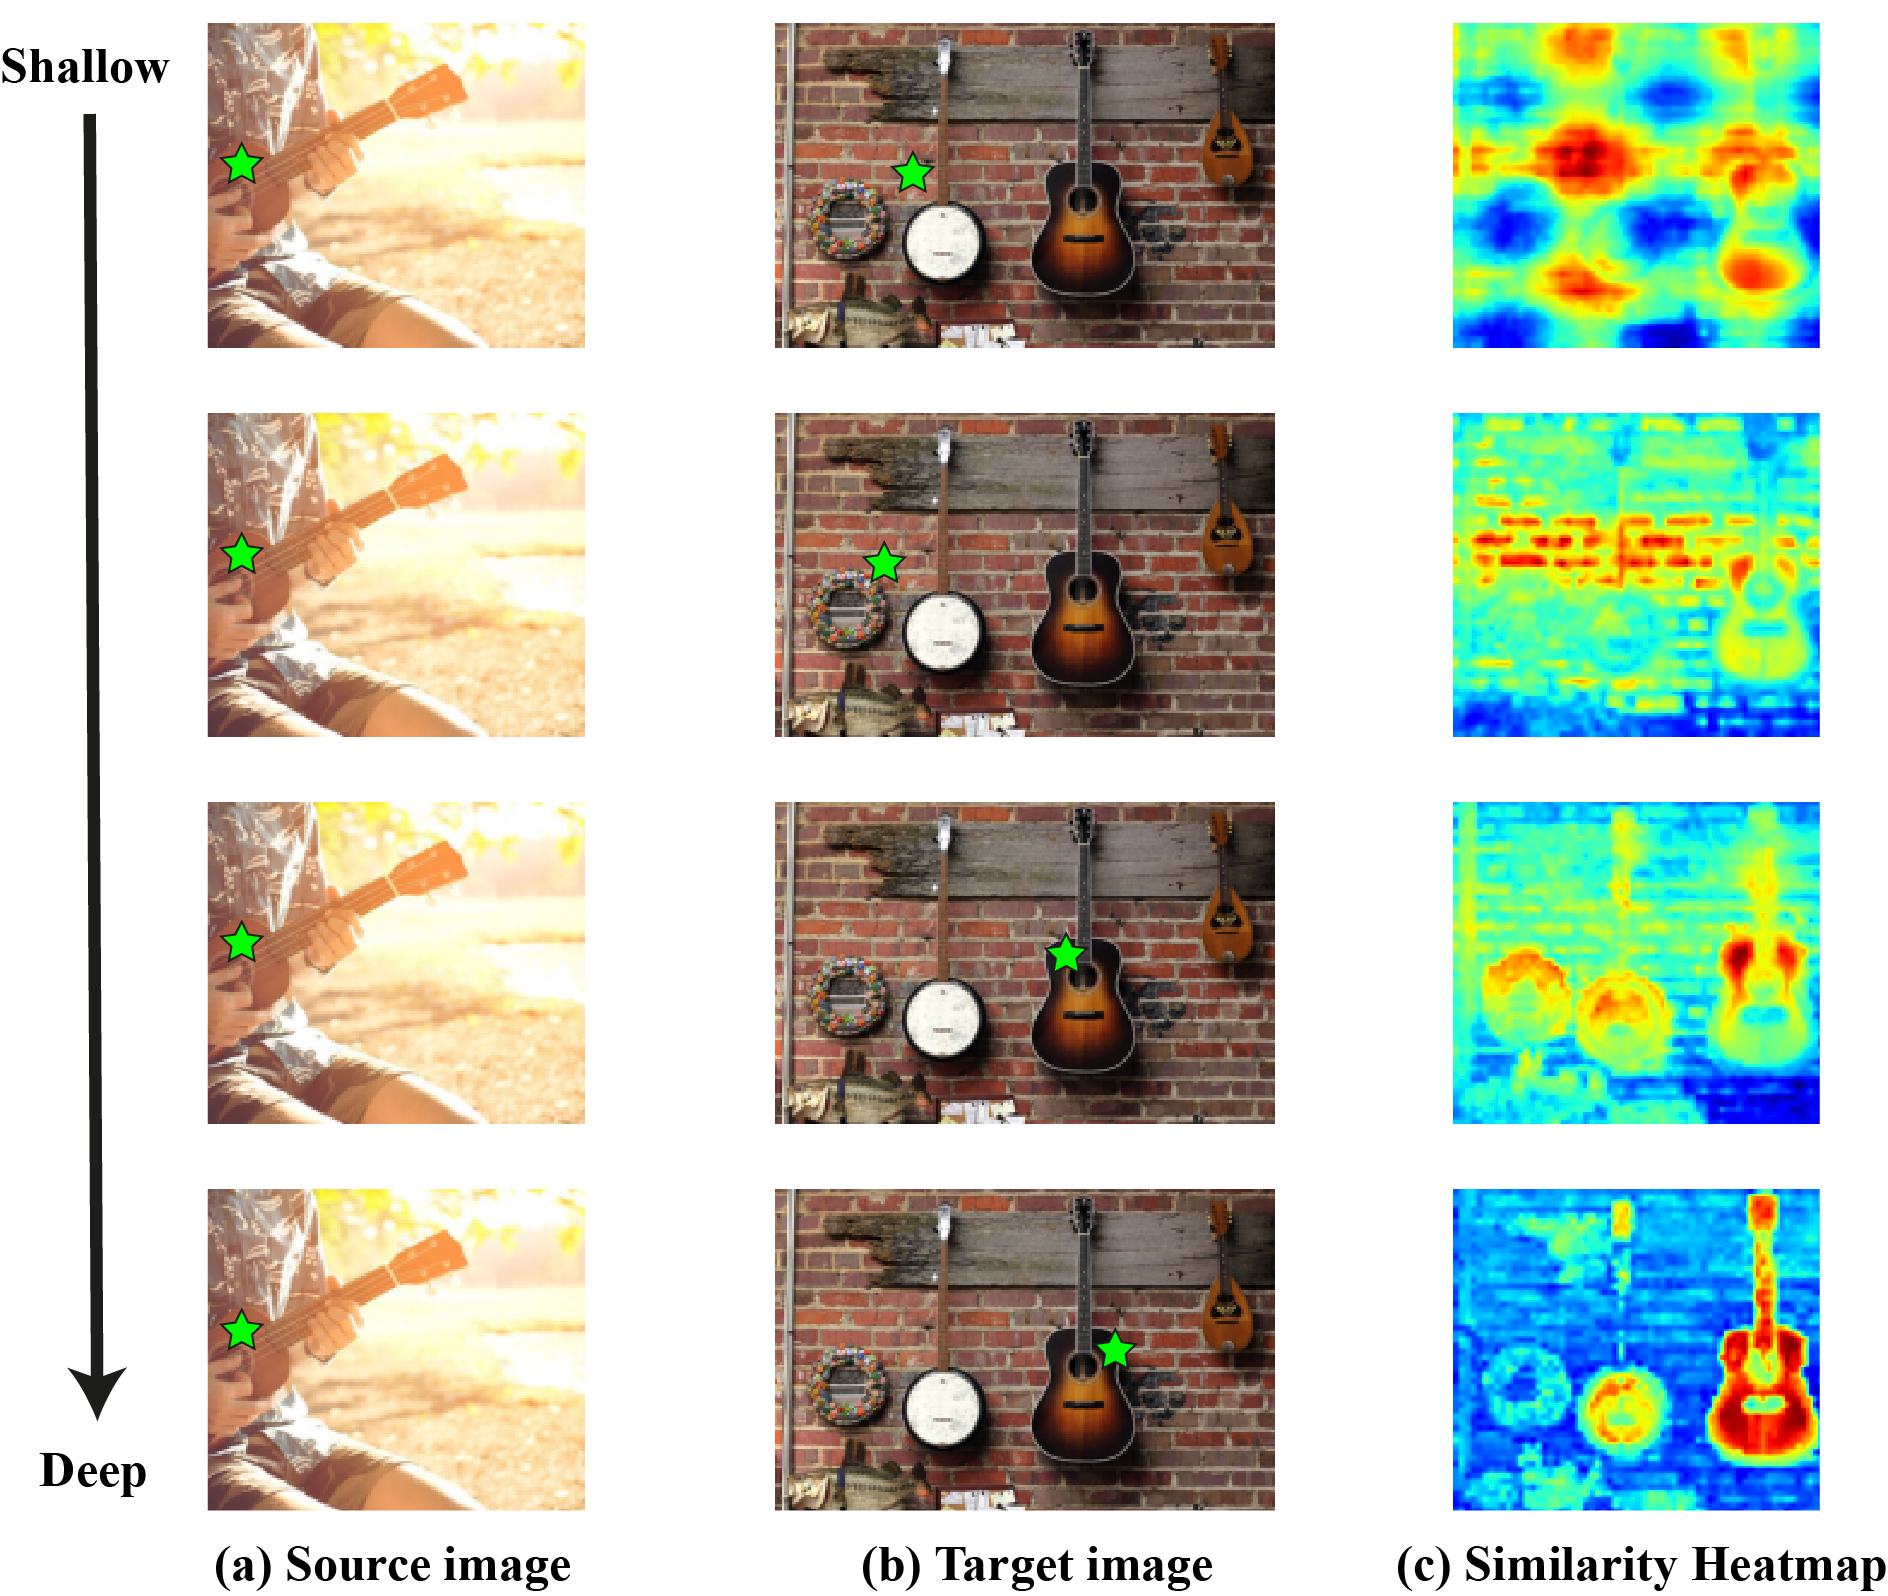
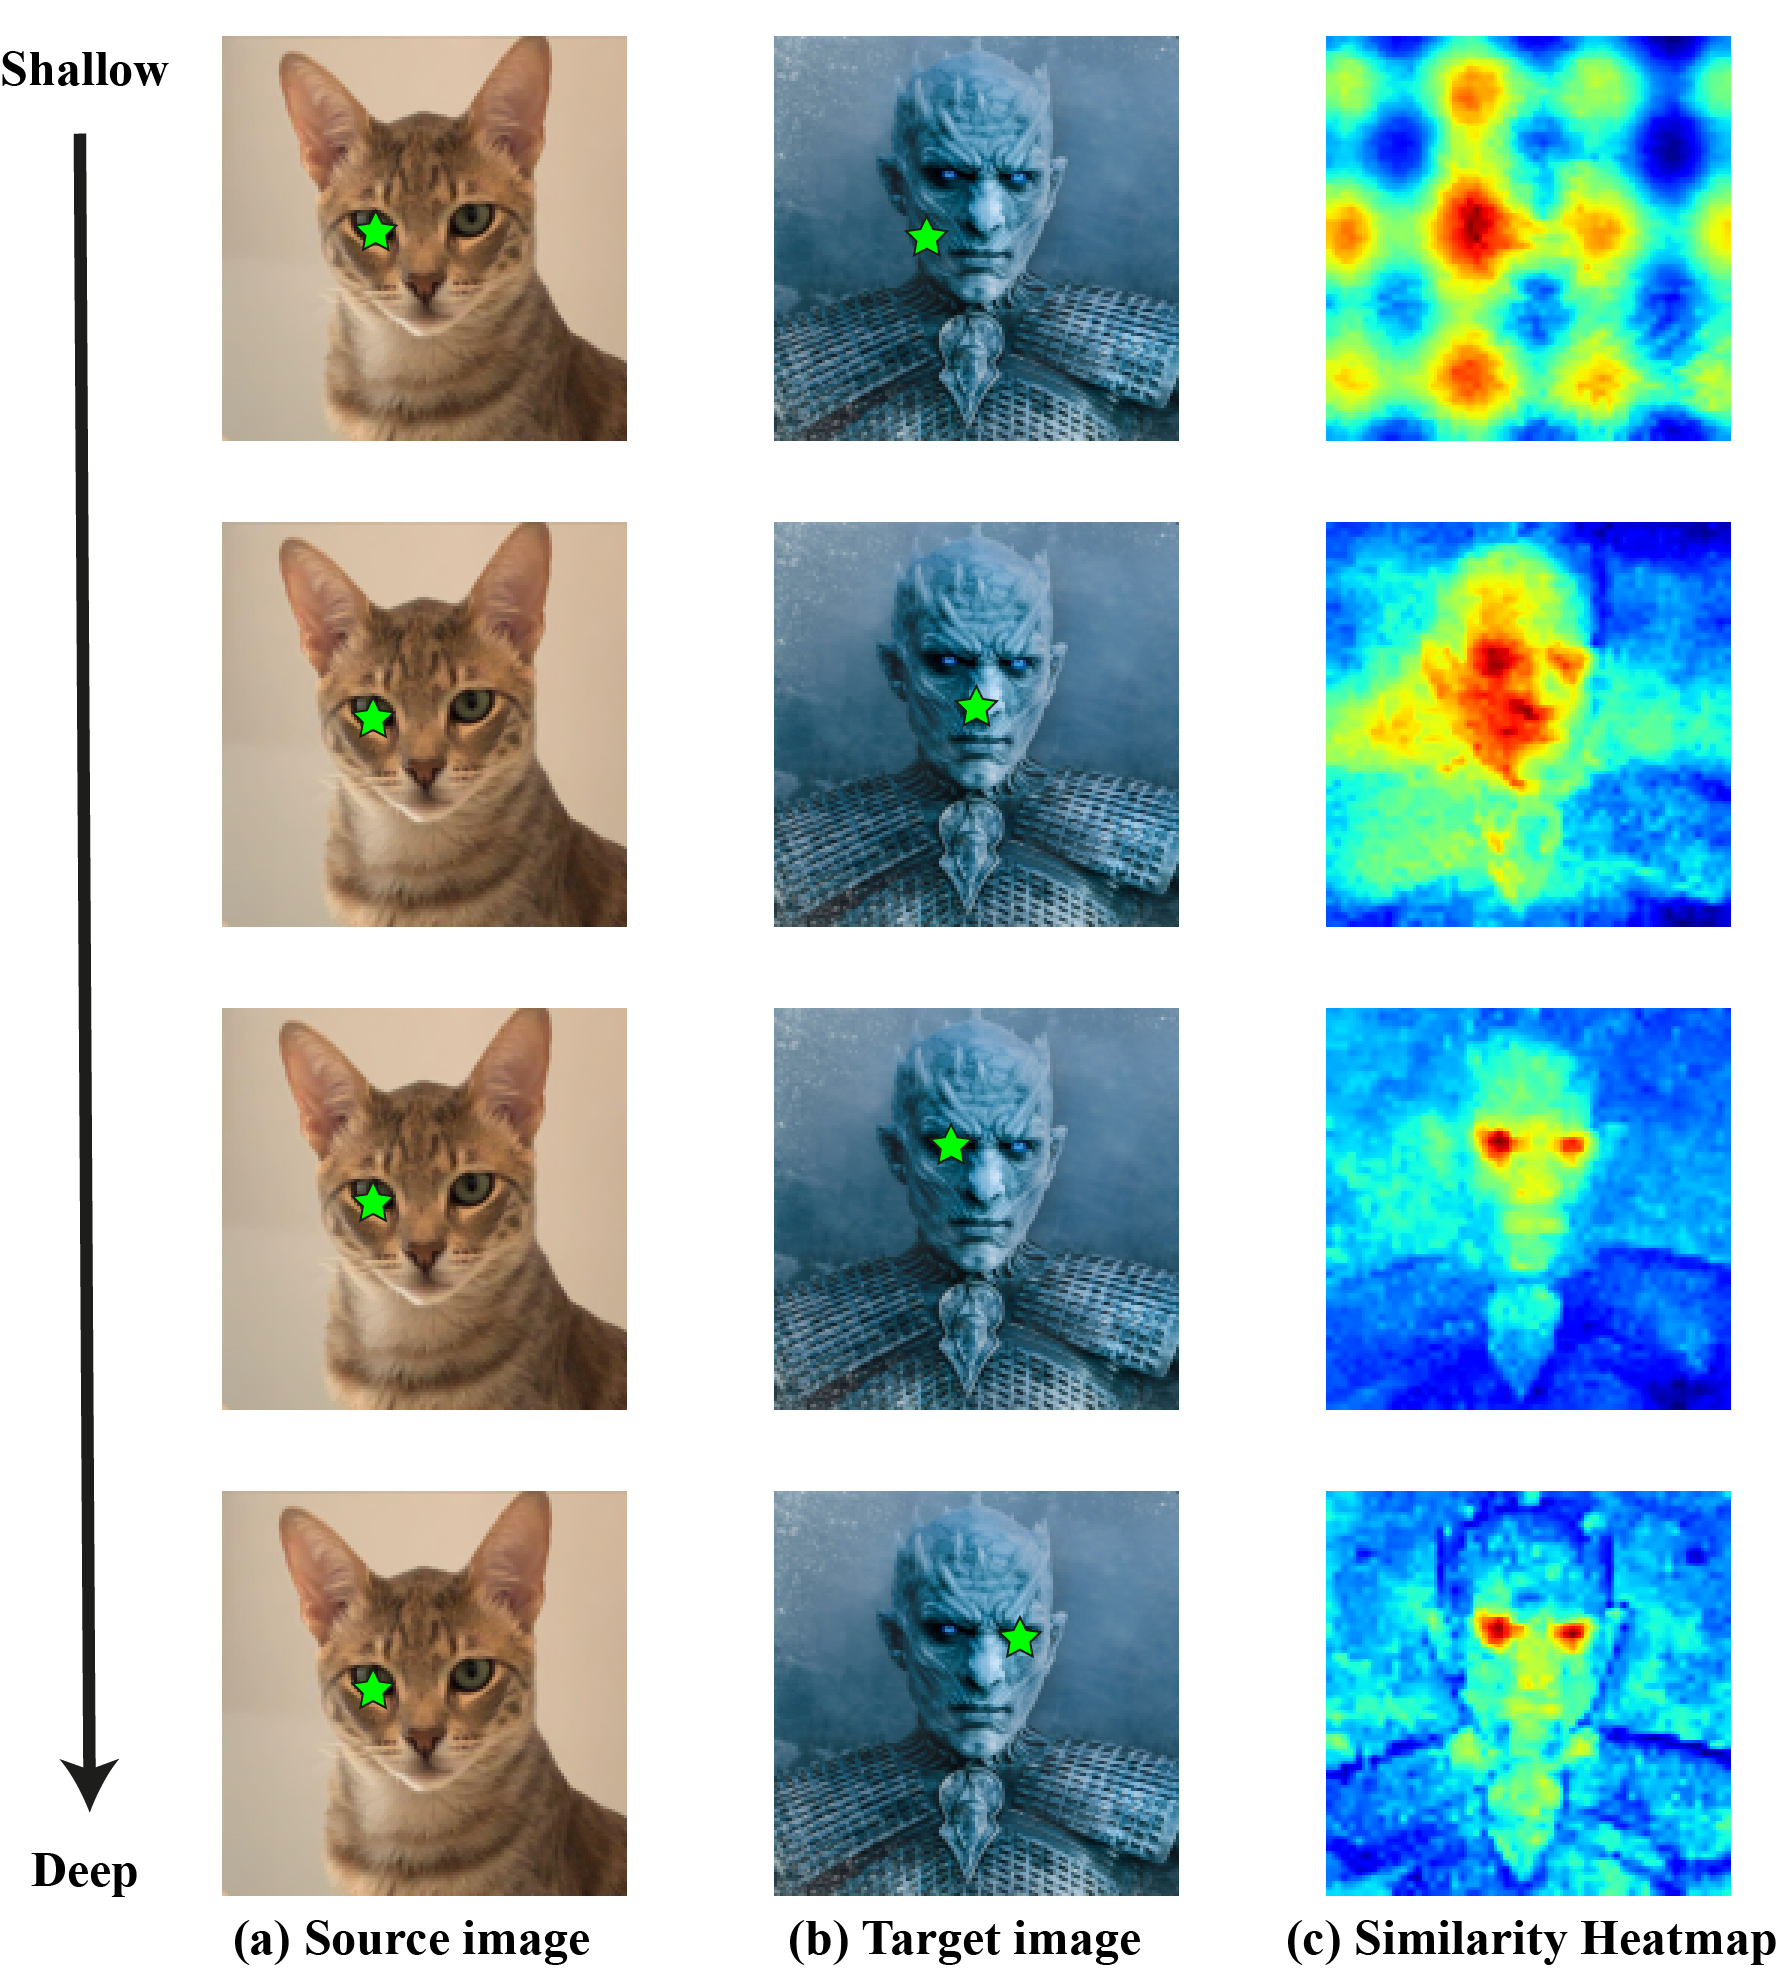
We provide an illustration for positional bias in early layers (see Fig. 4): Given a source image (a), with a chosen source point (marked by a green star), we visualize its nearest neighbor in the target image (b), also marked by a green star. We plot the similarity heatmap (c) between the source point and all target points in (b) (red is more similar). In shallow layers the similarity is mostly based on location, while the deep layers gradually trade position with semantic information. (e.g. leopard's tail is most similar to the legs with a similar location in early layers, and in the final layer is most similar to the tail.)